Did you know that about 65% of the world’s population are visual learners? This means that we (and yes, I would definitely classify myself as a visual learner) are more likely to grasp abstract concepts and ideas faster and to a higher extent using visual aids.
Visual aids do not necessarily have to be something a person can see and touch, they can absolutely be something that they can imagine.
In software development, there are many abstract concepts and terms that are presented to Product Owners. Due to their abstract nature, at times, it can be challenging to understand everything.
It goes without saying, that because we are the software developers, we should hold the knowledge for all those brilliant concepts, but we do need the ability to extend that knowledge to our Product Owners, especially when it comes to estimations.
Estimations, as we have seen in our blog, “How accurate are software estimations? Traditional vs Scientific Estimates,” involve a few different approaches to this aspect of building custom software.
In a perfect world, estimations would not be related to contract dates and billing but rather as a tool for the product owner to prioritise the backlog.
When we estimate, we are discussing the size of the scoped project stages broken down into its individual goal or milestones. These are sections of work that can be broken down into multiple user stories (or tickets, issues, etc. depending on the project management tool you are using).
Think of it as a feature or a page of an application. For example, the ability to create and submit a post on a Facebook wall is an epic. Then, all of the elemental items within that such as text input, graphical attachments and hashtags (plus so many more) are all stories within this epic.
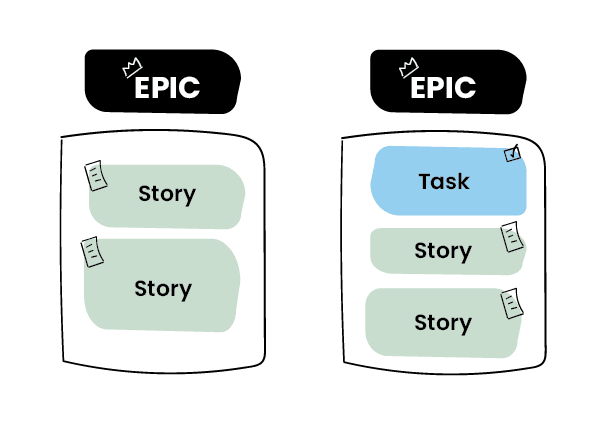
Each of these vary in size and complexity. The issue here is noting when something is seemingly simple but inherently difficult and being able to convey that complexity in a meaningful way to the Product Owner.
So, what do we do?
Introducing… The activity kit!!!
We run estimation activities to visually, or metaphorically, represent the size user stories are. Think back to that population breakdown of visual learners, 65% (!); we want to ease the grasping of this abstract concept as much as possible, so we use visual aids.
In the WorkingMouse scoping teams we have a product designer and a product developer who facilitate these activities.
Due to their subject matter expertise, I turned to them to help me flesh out the following questions:
- What are the activities we run?
- Why we do them? And,
- Do we have a preference as a company?
The estimation activities we run at WorkingMouse
1. T-Shirt Sizing
What is it?
This activity gives context to the size of the user stories that make up the entirety of the project. Each user story has an associated T-shirt size (i.e. S,M,L, etc.) decided by the scoping team.
Why do we do it?
It is pretty easy to imagine the size of a t-shirt in comparison to other t-shirt sizes. It is also a great conversation starter because sometimes, something seemingly small is actually regarded as a large item.
For example, single-sign-on (SSO).
SSO is very commonly used across large applications. For context, SSO is when you can jump onto an application (either web or mobile) and you need to create an account, a few options might pop-up to use to create this account. These options could be (but not limited to) your Google account or Facebook account.
These SSO options make the account creation process more efficient, but also make the returning user experience so much better.
So going back to our t-shirt sizing. Even though the user workflow for SSO is quite short, sharp, and simple, leading you to believe it will be a small t-shirt size, the actual integration with these accounts is quite complex.
Hence, the shirt size is large to contextualise the complexity.
Using this activity is great on a story-by-story basis but is also a great way to show the size of the overall project. The product developer can demonstrate the size of the project by grouping all of the user stories and their sizes together, and the product owner can follow along at a high level.
Think of it this way: a pile of laundry consisting of all large t-shirts is going to be larger than a pile of laundry consisting of all small t-shirts. So, if you only have a small washing machine, you are going to prioritise what can go in that load! Meaning you may pick the most important shirts to wash first.
To round out this laundry metaphor – the washing machine, is the budget/timeframe…i.e., what the product owner has specified are the constraints the project must operate within.
2. Fibonacci
What is it?
Taking you back to your primary school mathematics class, this sequence demonstrates the constant addition of numbers using the previous. 0, 1, 1, 2, 3, 5, 8, 13, 21, 34, 55…etc.
We use Fibonacci numbers (or sequencing) to help us manage the error in our estimations.
We need to remember that estimations are, by definition, already incorrect predictions of the future. They are essentially well-intentioned guesses.
As such, being too specific with our estimations can result in a larger error rate due to the inherit inaccuracies within the estimates. We need to give ourselves a buffer margin.
What we generally want to know is relative effort of the work. We can then define a baseline for a well-known item of work (i.e., something that we estimate at 2 hours is generally very well understood) and multiple out by our factors.
For example, Ticket A is at least twice as much work as Ticket B.
Ticket B may be 2 hours; therefore, Ticket A is estimated at 4 hours.
It is much more challenging to be able to say, Ticket A is 1.3 times as much work as Ticket B.
…Thus, Fibonacci.
Why do we do it?
Similar to t-shirt sizing, this is a way to represent the complexity in each of the user stories in comparison to each other.
Additionally, as I quickly mentioned above, this sequencing pattern allows for us to factor in margin of error, or, more specifically, risk. It is incredibly important to note that there is an element of risk with everything we develop.
This isn’t meant to scare anyone off, risk is associated with everything. The crucial factor here is what we do with that risk and how do we scientifically account for it.
At WorkingMouse, we have formed, iterated on and continuously improved our risk management calculation process. This is calculated as a multiplication of the complexity and the unfamiliarity of each user story.
Sure, a calculation is mathematical therefore it should be correct, but the key to remember here is that the factors that make up our calculations are estimates and therefore should be considered as an estimated calculation.
3. Poker Cards
What is it?
“Show me yours and I’ll show you mine” is kind of the concept we are going with here. The idea is that we involve an objective third party (usually another product developer) to estimate the project alongside the scoping product developer.
There is not much collaboration here until the estimates are complete. What we want to achieve is consensus between the two developers that isn’t blind-sided by context.
Firstly, the team uses some time to discuss and get a better understanding of the ticket and any risks or assumptions, without mentioning any estimation numbers so estimates aren’t biased.
Once the team has discussed this, it is time to estimate. Usually using numbered cards, each developer will choose a card (or write a number down), and reveal their estimate simultaneously.
Why do we do it?
Realistically, we don’t always have the time allowance to complete this estimations process - it can be a pretty lengthy process. In saying this, the process of engaging another product developer to ‘sense check’ the estimations is something we do carry out.
So, what do we do at WorkingMouse?
A good scientist doesn’t rely on one method, they have an array of methodologies to get an answer they are satisfied with. Therefore, we don’t necessarily have a preferred method of the above (or of the numerous others that are out there). We use a combination, or at least the favourable elements, of the above to determine the most scientific estimations possible.
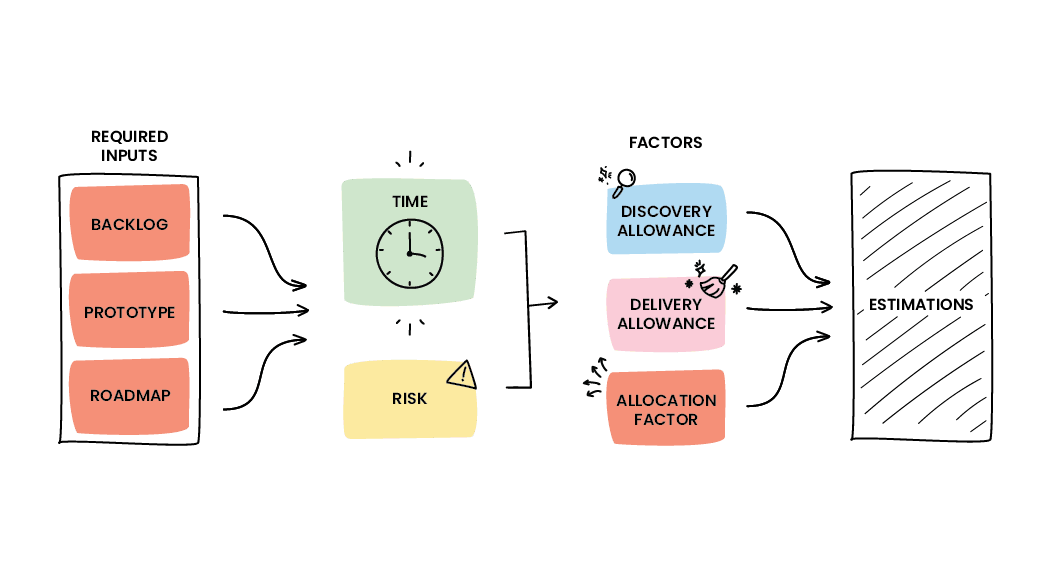
Because of this tandem method, we use the same process across all of our projects. This is the best way to ensure consistency, professionalism, and confidence. You can read more about our estimation process here..
Estimating a project is a heavily involved process, but with the right team and process, it can be a successful venture.