Dealing with Risk When Using Agile to Develop Software
Risk, it is everywhere and no matter how hard you try, it is impossible to escape. To deal with the inevitable risk that comes with the software development process, we must find ways to identify, mitigate and accurately allocate time to risk. This enables a team to keep to project timelines and not have them blow out. This article will outline how we approach risk throughout the various stages of agile development and the steps we take to de-risk our projects. There is risk under every stone throughout the software development process, so we will only be touching on a few of the places where risk is found and how best to deal with it.
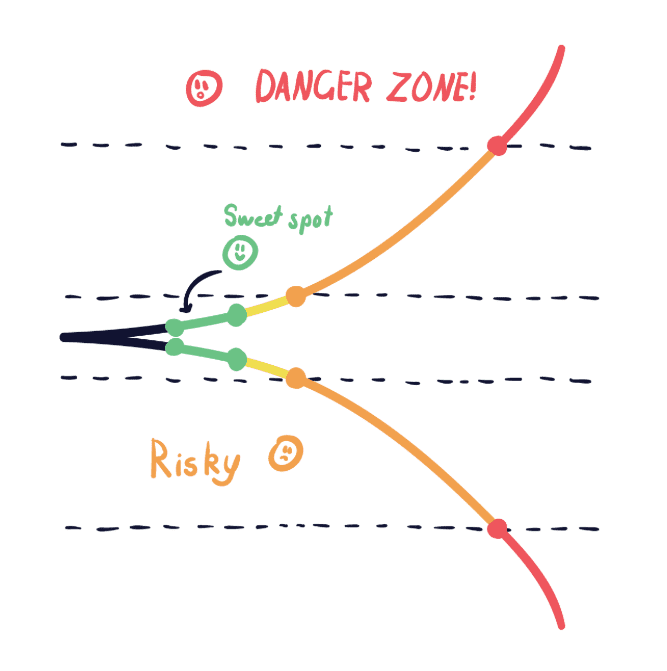
The Cone of Uncertainty
The beginning of any software development project is by far the riskiest time for all involved if not approached from the right angle. The Cone of Uncertainty (available below) is a depiction that as we go further into the future there is more that we are uncertain about. There are so many other factors that may impact a project in 6 months time that we just don't know about current. For example, Apple/Google may update their software requirements or a particular plugin we were planning to use has reached end of life.
This is why it's important to break down the project into smaller builds. Each build can be scoped at the relevant time allowing greater certainty around the estimated length. This is the premise of agile software development but it helps to understand the 'why.'


.png)