Anticipatory Design: The Future of UX Design
The Industrial Revolutions of 1760 and 1820-1840 were complete game changers. An economic and social order thousands of years in the making was remade. The economy, society, culture everything became centred around industry.
Today we are living through a data revolution that's no less important than the Industrial Revolutions. In this "Information Age", data has taken industry's place at the centre of all things.
Every day data is collected and analysed. Collectively, Google, Amazon, Facebook and Microsoft have collected more than 1,000 petabytes (1,000,000,000 gigabytes) of data.
But what good is data? Are businesses and governments collecting data without rhyme or reason? No. Data is driving innovation and change worldwide, especially in user experience (UX) design.
Anticipatory Design
Perhaps the next big thing in the realm of UX is Anticipatory Design: design that's one step ahead and anticipates end user behaviour and preferences.
Imagine a website, which knew you liked reading reviews by industry experts, automatically responding to your inclinations by linking to expert reviews. Meanwhile, someone else, who only cares about price, is shown price comparisons between the site and its competitors. In both cases, the (presumably positive) UX is the product of an anticipated and responsive design.
This is what Anticipatory Design is at its core: a process wherein data-driven decisions are made on behalf of end users.
Data Driven Design: The Probability of Being Right/Wrong
Anticipatory Design is commonly used to streamline processes. You have almost certainly experienced this. When Spotify suggests a song, it's not shooting in the dark, it's making an educated guess based on your habits and history. It's anticipating what songs you could like.
Anticipatory Design has cousins in selection simplification and choice editing. Sophie Kleber of Huge Inc. plots these typologies of automatic curation on a cartesian plane, with one axis representing the probability of bring right and the other axis representing the cost of being wrong.
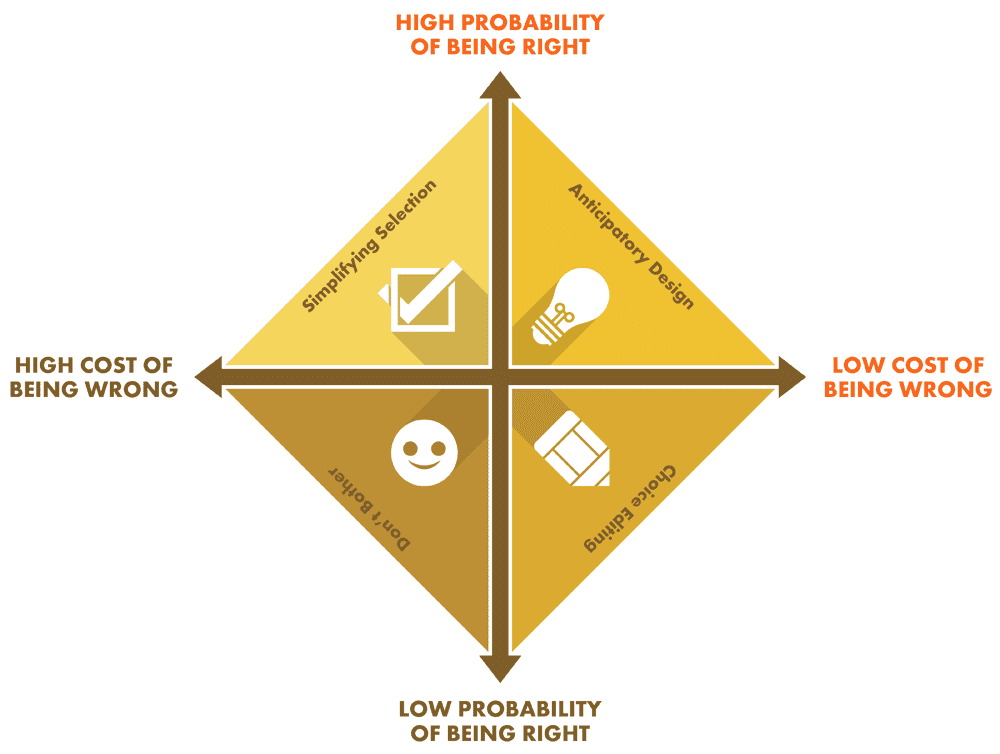


.png)